Force-directed graph layouts revisited: a new force based on the t-Distribution
Fahai Zhong, Mingliang Xue, Jian Zhang, Fan Zhang, Rui Ban, Oliver Deussen, Yunhai WangAbstract
In this paper, we propose the t-FDP model, a force-directed placement method based on a novel bounded short-range force (t-force) defined by Student’s t-distribution. Our formulation is flexible, exerts limited repulsive forces for nearby nodes and can be adapted separately in its short- and long-range effects. Using such forces in force-directed graph layouts yields better neighborhood preservation than current methods, while maintaining low stress errors. Our efficient implementation using a Fast Fourier Transform is one order of magnitude faster than state-of-the-art methods and two orders faster on the GPU, enabling us to perform parameter tuning by globally and locally adjusting the t-force in real-time for complex graphs. We demonstrate the quality of our approach by numerical evaluation against state-of-the-art approaches and extensions for interactive exploration.
Results
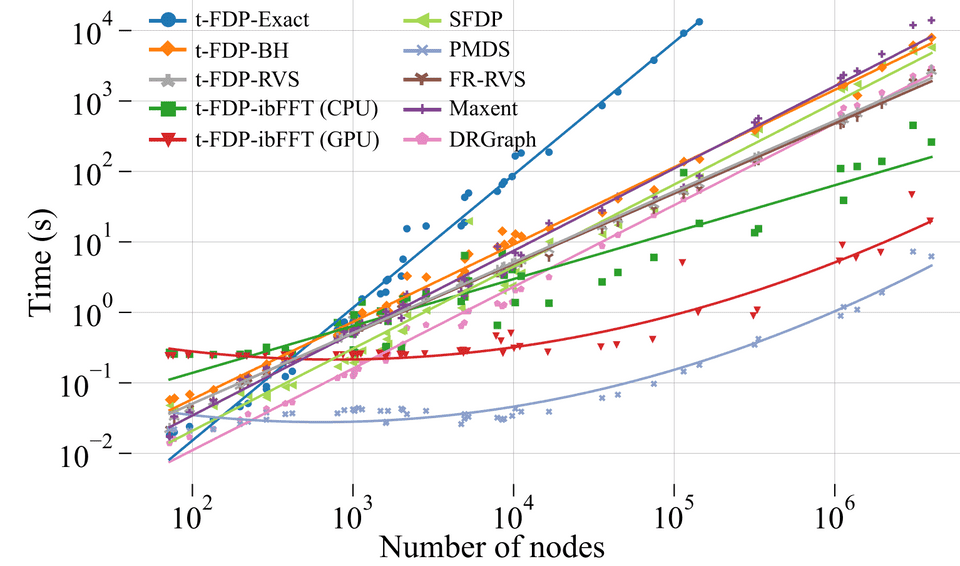
Figure 1: Computation time of five different implementations of our t-FDP model in comparison to five other methods, which can process all datasets.
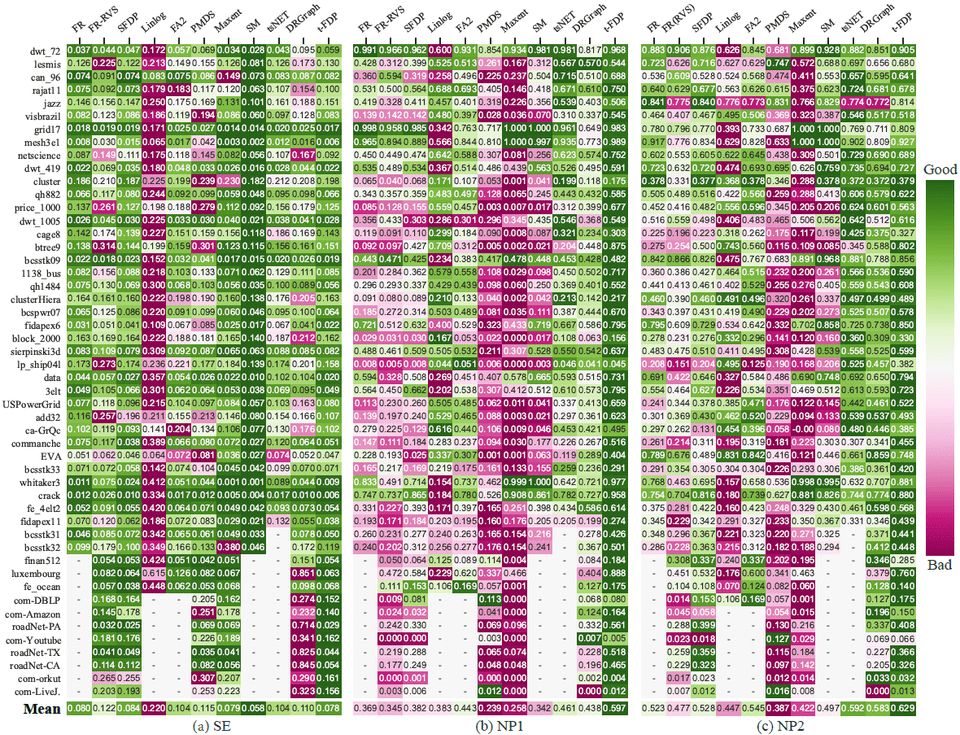
Figure 2: Heatmaps with a color-blind friendly pink-to-green colormap are used to present the values of SE (a), NP1 (b), and NP2 (c) for layouts generated by ten layout methods on 50 datasets, where the empty cell indicates the graph is too large to be processed by the corresponding layout method. Each row represents a dataset, and each column a layout method. All rows are colored relatively with regard to best and worst value.
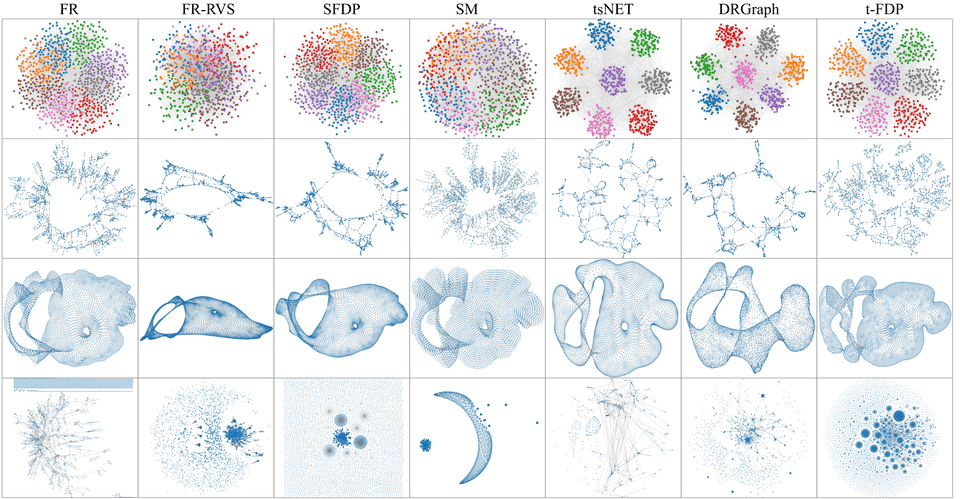
Figure 3: Layouts by seven methods for the four data sets: cluster (top row), bcspwr07 (second row), 3elt (third row), and eva(bottom row). t-FDP shows a good ability to highlight clusters, at the same time a good mixture between local and global structures for bcspwr07 and a good unfolding for 3elt.
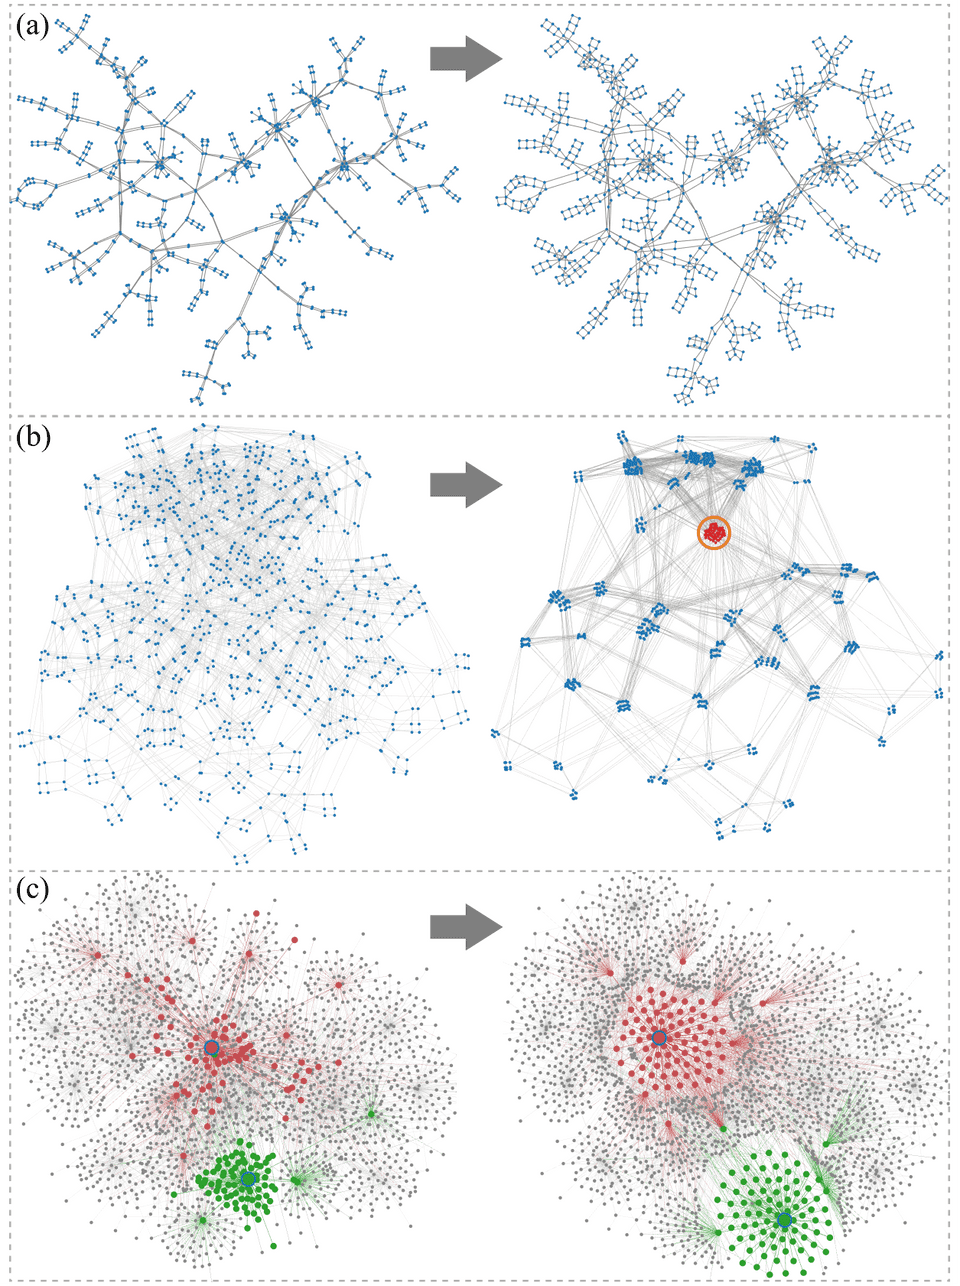
Figure 4: Refining t-FDP graph layouts by applying a large repulsive force (a), and a repulsive force with shorter range (b), and locally changing attractive and repulsive forces (c). These result in uniform distributed local neighborhoods (a), major clusters (b), and fisheye views (c).
Acknowledgements
The authors like to thank the anonymous reviewers for their valuable input, this work was supported by the grants of the National Key Research & Development Plan of China (2019YFB1704201), Shandong Provincial Natural Science Foundation (ZR2022JQ32) and NSFC (62132017, 62141217), as well as by the Deutsche Forschungsgemeinschaft (DFG, German Research Foundation) under Germany’s Excellence Strategy - EXC 2117 - 422037984.


