Canis: A High-level Language for Data-Driven Chart Animations
Tong Ge, Yue Zhao, Bongshin Lee, Donghao Ren, Baoquan Chen, Yunhai WangAbstract
In this paper, we introduce Canis, a high-level domain-specific language that enables declarative specifications of data-driven chart animations. By leveraging data-enriched SVG charts, its grammar of animations can be applied to the charts createdby existing chart construction tools. With Canis, designers can select marks from the charts, partition the selected marks intomark units in terms of data attributes, and apply animation effects to the mark units, with the control of when the effects start.The Canis compiler automatically synthesizes the Lottie animation JSON files [Aira], which can be rendered natively across multiple platforms. To demonstrate Canis’s expressiveness, we present a wide range of chart animations. We also evaluate its scalability by showing the effectiveness of our compiler in reducing the output specification size and comparing its performanceon different platforms against D3.
Links
- Project Page: https://canisjs.github.io/
- Online Editor: https://canisjs.github.io/canis-editor/
dSVG & Schema Illustration
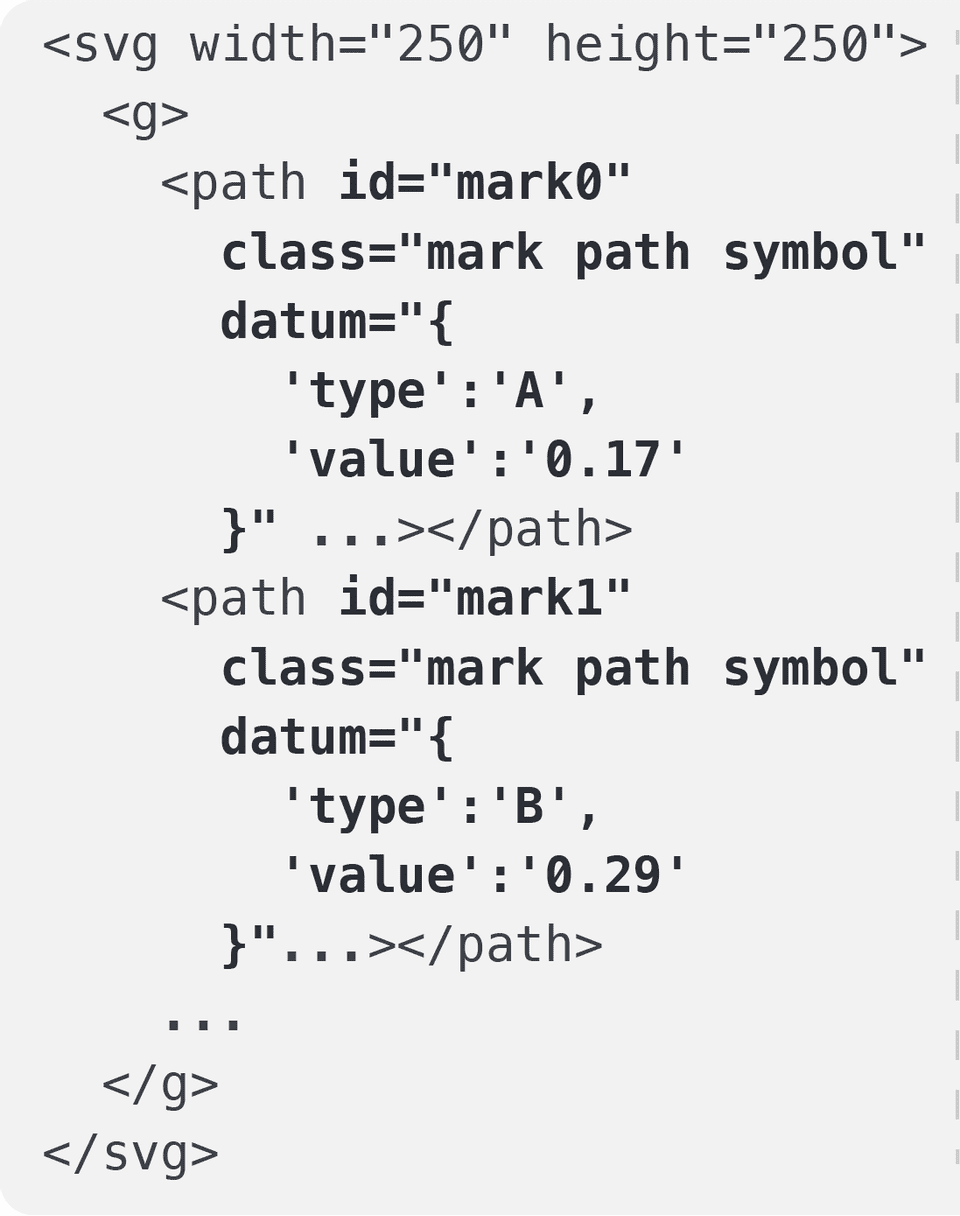
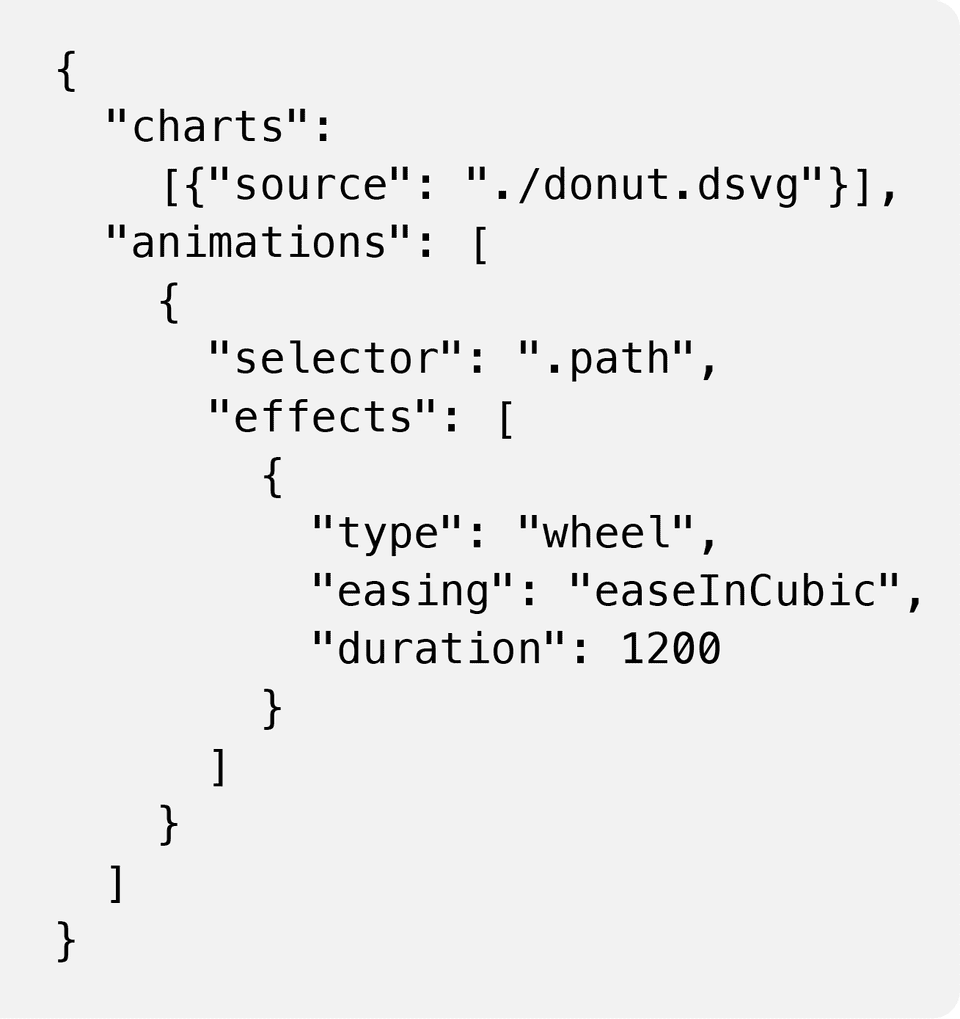
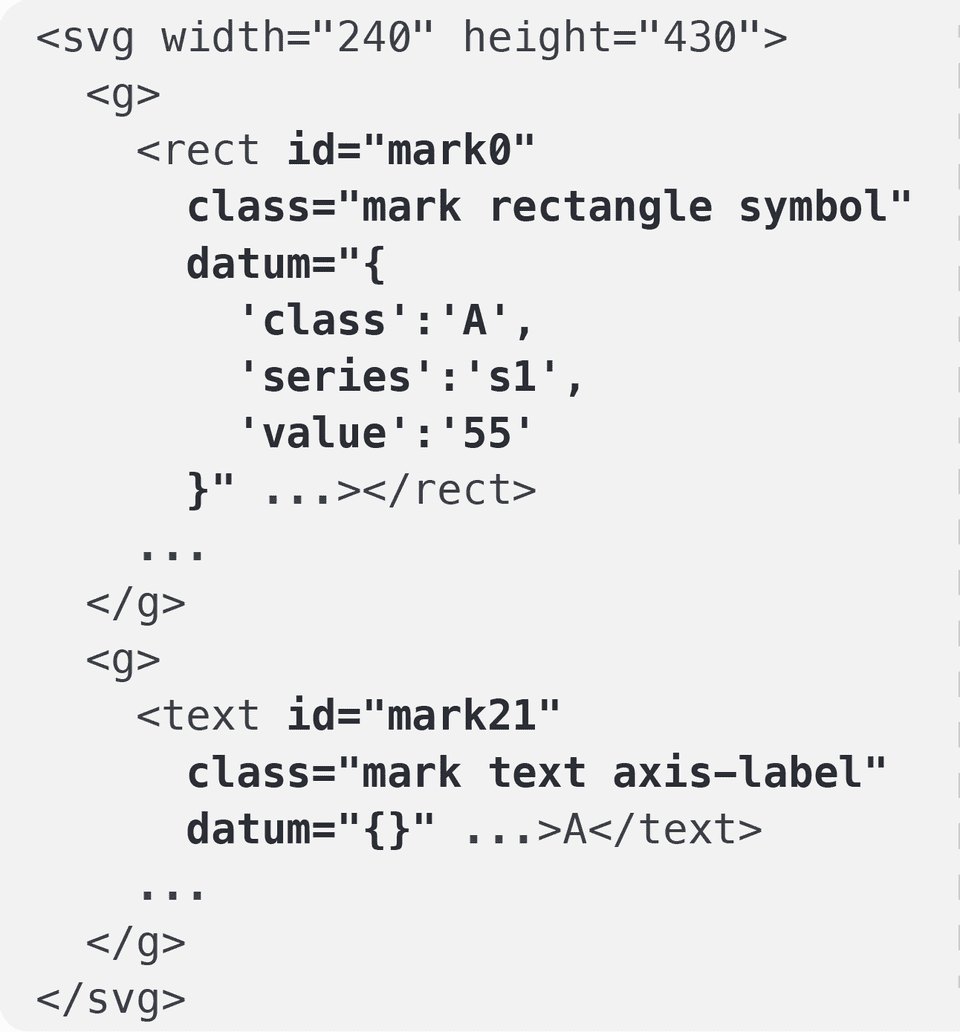
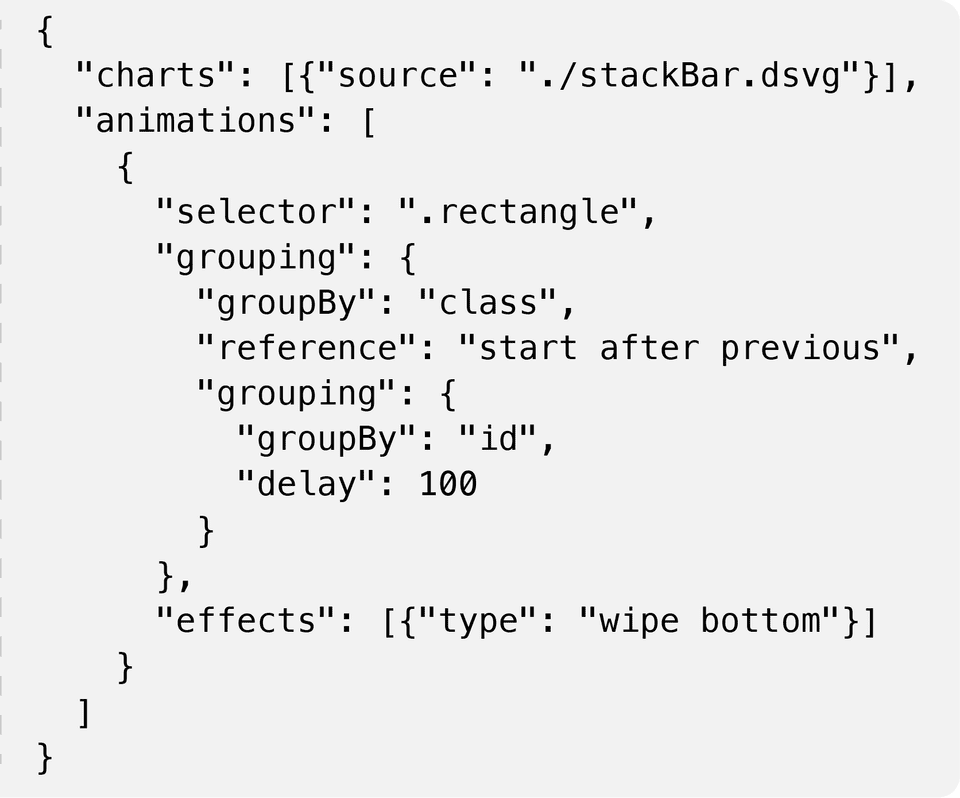
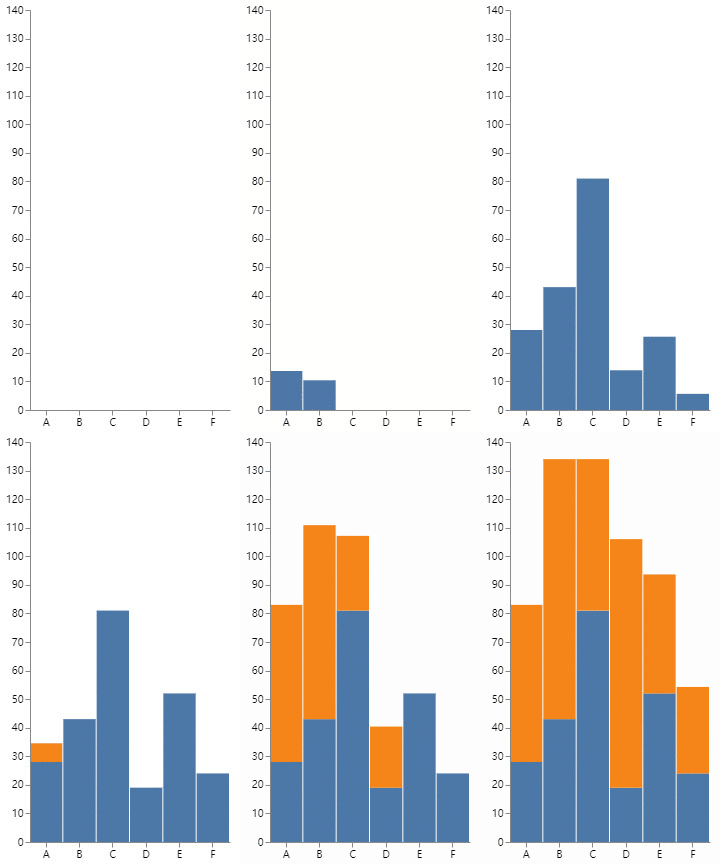
The example input dSVGs and Canis specifications for animating two different charts with different animation effects: (a) a donutchart with the “wheel” effect and a bar chart with the “wipe bottom” effect.
Meaningful Partition
Specification for animating the faceted dot plot with a nested partitioning: (a) input scatterplot encoding three variables (Surface, OdorandIsEdible); (b) Canis specification where three variables used for the nested partitioning are highlighted; and (c) mark unit treefor partitioning the marks into keyframes.
Compiler
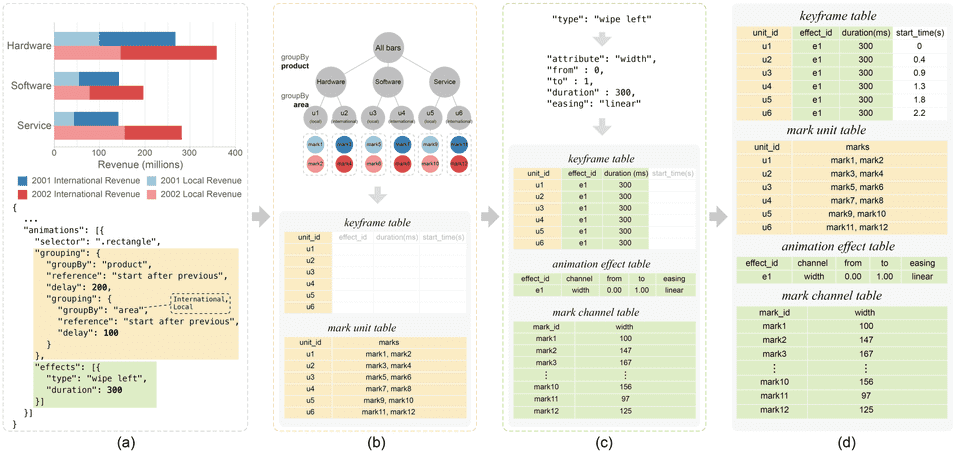
Illustration of the build-bind-evaluate three steps with a grouped bar chart. (a) The input of the grouped bar chart and the unit specification; (b) the build phase constructs the mark unit tree and updates the mark unit table and animation keyframe table; (c) the bind phase associates the animation effect into the mark units and updates the animation effect table, mark channel table and animation keyframetable; and (d) the evaluation phase computes the starting time of each effect listed in the keyframe table. Note that the involved informationfor mask partitioning and animation effects are shown on yellow and green background, respectively.a
Results
Acknowledgements
This work is supported in part by the grants of the National Key Research & Development Plan of China (2016YFB1001404) and NSFC (61772315, 61861136012).
