A Recursive Subdivision Technique for Sampling Multi-class Scatterplots
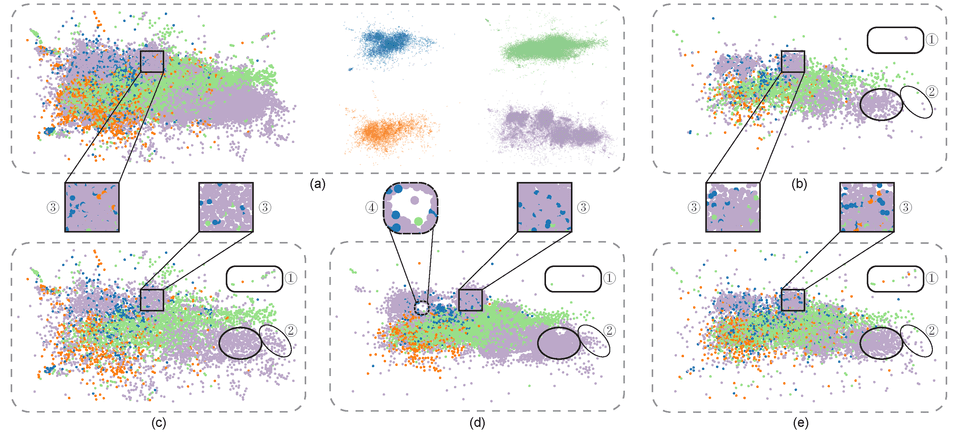
Xin Chen, Tong Ge, Jian Zhang, Baoquan Chen, Chi-Wing Fu, Oliver Deussen, Yunhai WangFigure 1: Different sampling methods for presenting the four-class Person Activity data [8]. (a) The left shows the input scatterplots with 100K points and the right shows the four classes separately, where the patterns of each class are obscured in the main plot, e.g., the three sub-clusters in the purple class, due to overdraw. We re-sample the data into ∼5000 points using (b) random sampling, (c) non-uniform sampling [4], (d) multi-class blue noise sampling [11], and (e) our method. The results show that our method better preserves major outliers (see the rounded boxes labeled with “1”), relative data densities (see the ellipse labeled with “2” to compare (c) with (d)), and the relative class densities (see the orange points shown in the squares labeled with “3” in (a)-(e)), without introducing obvious visual artifacts such as highlighted by the square in (d) labeled with “4”. Points for all results are rendered in random order.
Abstract
We present a non-uniform recursive sampling technique for multi-class scatterplots, with the specific goal of faithfully presenting relative data and class densities, while preserving major outliers in the plots. Our technique is based on a customized binary kd-tree, in which leaf nodes are created by recursively subdividing the underlying multi-class density map. By backtracking, we merge leaf nodes until they encompass points of all classes for our subsequently applied outlier-aware multi-class sampling strategy. A quantitative evaluation shows that our approach can better preserve outliers and at the same time relative densities in multi-class scatterplots compared to the previous approaches, several case studies demonstrate the effectiveness of our approach in exploring complex and real world data.
Acknowledgements
This work is supported by the grants of the National Key Research & Development Plan of China (2016YFB1001404), NSFC (61772315, 61861136012), the Leading Talents of Guangdong Program (00201509), the DFG Center of Excellence 2117 Centre for the advanced Study of Collective Behaviour (ID: 422037984), the DFG Project 493/19 Perception-based Information Visualization, and Shenzhen Science and Technology Program (Project no. JCYJ20170413162617606).
