Structure-aware Fisheye Views for Efficient Large Graph Exploration.
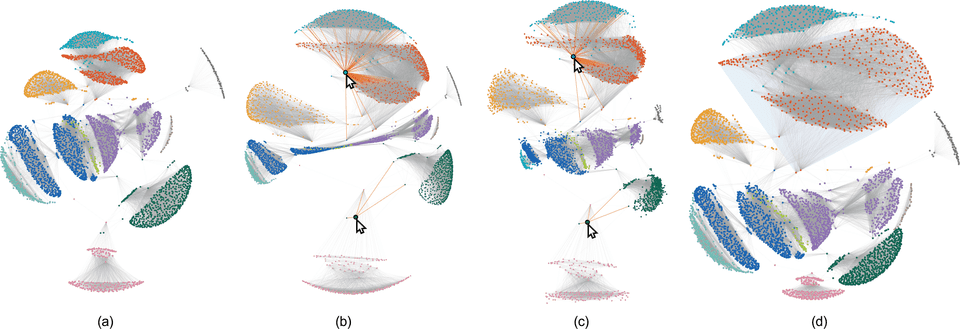
Yunhai Wang, Yanyan Wang, Haifeng Zhang, Yinqi Sun, Chi-Wing Fu, Michael Sedlmair, Oliver Deussen, Baoquan ChenFigure 1: Magnifying a node-link diagram (a) with 11 clusters around a user-specified location (indicated by the cursor) using different fisheye lenses: (b) graphical fisheye; (c) hyperbolic fisheye; and (d) our structure-aware fisheye, which aims to maintain the shapes of almost all clusters and to minimize their distortions, such as in (b,c).
Abstract
Traditional fisheye views for exploring large graphs introduce substantial distortions that often lead to a decreased readability of paths and other interesting structures. To overcome these problems, we propose a framework for structure-aware fisheye views. Using edge orientations as constraints for graph layout optimization allows us not only to reduce spatial and temporal distortions during fisheye zooms, but also to improve the readability of the graph structure. Furthermore, the framework enables us to optimize fisheye lenses towards specific tasks and design a family of new lenses: polyfocal, cluster, and path lenses. A GPU implementation lets us process large graphs with up to 15,000 nodes at interactive rates. A comprehensive evaluation, a user study, and two case studies demonstrate that our structure-aware fisheye views improve layout readability and user performance.
Results
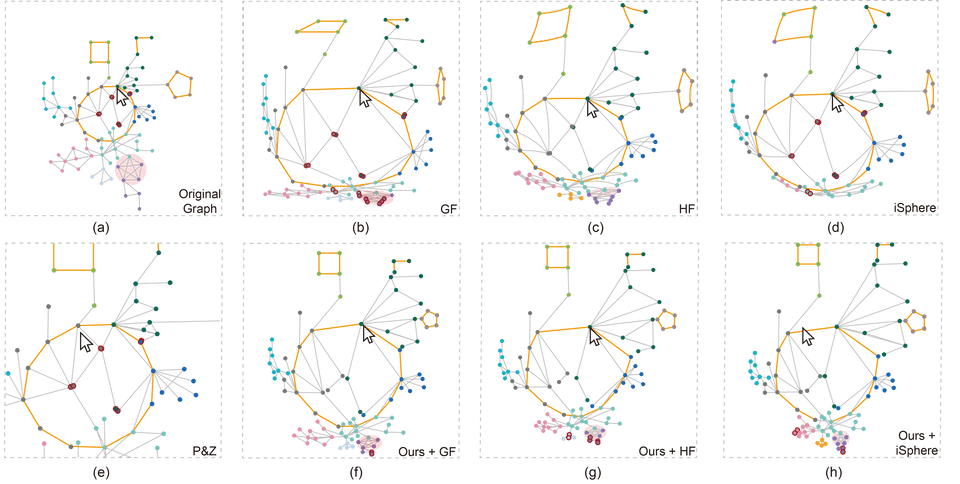
Figure 8: Visual comparison of various fisheye methods: (a) the original graph; (b) graphical fisheye (GF); (c) hyperbolic fisheye (HF); (d) iSphere; (e) linear magnification; (f) our method with graphical fisheye; (g) our method with hyperbolic fisheye; and (h) our method with iSphere.
Figure 11: Exploration on the EGO-NETWORK dataset [35]. (a) Input graph layout. (b) Result generated by the polyfocal projection, where the cluster structures are seriously distorted. (c) Result generated by our polyfocal magnification lens. The two center nodes are highlighted with a red halo, and the edges to their neighbors are shown in yellow. (d) Results generated by our cluster magnification lens. The red focus cluster is highlighted with a gray background, while the shapes of the other clusters are preserved.
Figure 12: Exploration of a graph of major cities in the United States [42]. Edges represent the distances or driving time between associated pairs of neighboring cities. (a) Input graph layout. (b) Result generated by our cluster magnification lens, where the focus region is on the light blue background. (c) Result generated by our path magnification lens, where the path from Washington D.C. to Kansas is highlight in red, the child edges of the path in blue, and the edges that are less thanaway from the path in blue.
Acknowledgements
This work is supported by the grants of the National Key Research & Development Plan of China (2016YFB1001404), NSFC (61772315), NSFC-Guangdong Joint Fund (U1501255), Leading Talents of Guang- dong Program (00201509), Shandong Provincial Natural Science Foun- dation (ZR2016FM12), the Open Research Fund of Beijing Key Labo- ratory of Big Data Technology for Food Safety, Beijing Technology and Business University, and the Fundamental Research Funds of Shandong University.


