Interactive Context-Preserving Color Highlighting for Multiclass Scatterplots
Kecheng Lu, Khairi Reda, Oliver Deussen, Yunhai WangAbstract
Color is one of the main visual channels used for highlighting elements of interest in visualization. However, in multi-class scatterplots, color highlighting often comes at the expense of degraded color discriminability. In this paper, we argue for context-preserving highlighting during the interactive exploration of multi-class scatterplots to achieve desired pop-out effects, while maintaining good perceptual separability among all classes and consistent color mapping schemes under varying points of interest. We do this by first generating two contrastive color mapping schemes with large and small contrasts to the background. Both schemes maintain good perceptual separability among all classes and ensure that when colors from the two palettes are assigned to the same class, they have a high color consistency in color names. We then interactively combine these two schemes to create a dynamic color mapping for highlighting different points of interest. We demonstrate the effectiveness through crowd-sourced experiments and case studies.
Results

Figure 1: Results for applying different color-based highlighting methods for highlighting points in a multi-class scatterplot. (a) (top) colorization with Tableau palette and default assignment; (bottom) highlighting effect achieved by assigning a grey color to all non-selected data points; (b) (top) result for a Palettailor-generated palette [21]; (bottom) highlighting achieved by increasing lightness of non-selected data points; (c) (top) colorization by Tableau palette and optimal assignment; (bottom) highlighting by applying Tableau Highlighter function; (d) (top) colorization by our method using a salient color palette; (bottom) highlighting result by combining salient and faint color mapping schemes. Our method allows highlighting a subset of data points while maintaining the discriminability of all non-selected points as well as the color consistency of all color pairs.

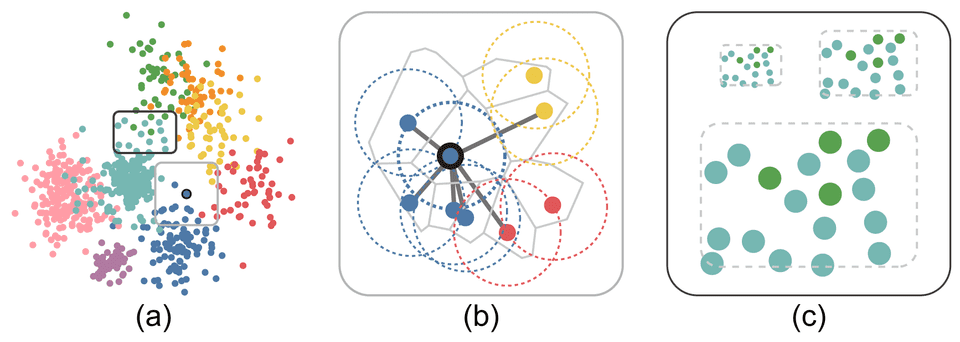
Figure 2: Illustrating the nearest neighbors of each data point and the influence of mark size in the perceived color difference for an input scatterplot (a) with two regions selected to zoom-in in (b,c). (b) The nearest neighbors for the selected point are defined by the α-shape graph; (c) a subset of data points selected from (a) shown in three different sizes.

Figure 3: Results generated for two different backgrounds: grey (a,b) and blue (c,d). (a,c) the salient palettes and the colorized scatterplots; (b,d) the faint palettes and the colorized scatterplots.

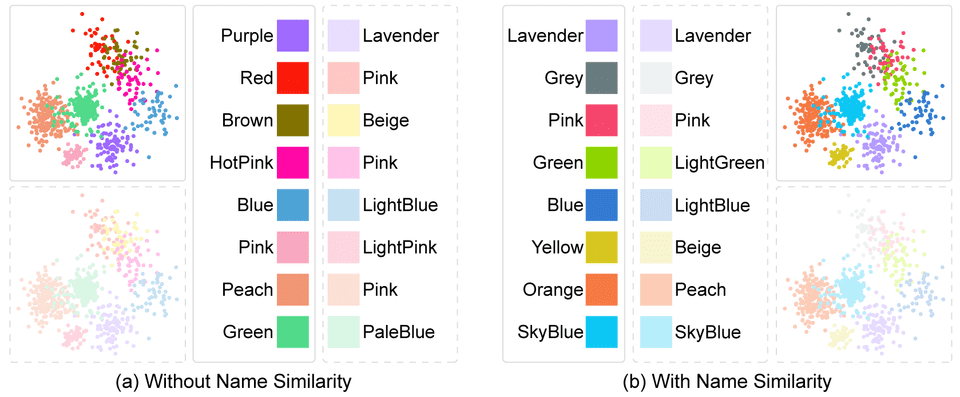
Figure 4: Comparing palettes generated by without (a) and with (b) name similarity terms. The results with solid borders are created by the salient palettes and the ones with the dashed border are created by the faint palettes.

Figure 5: Illustration of tasks: (a) counting task; (b) selecting task; (c) highlighting task and (d) matching task. The scatterplot is from one of the datasets used in the experiment. Here, we apply a Tableau-provided color palette with randomized rotation to avoid learning effects.

Figure 6: Exploring the MNIST dataset [16] with our context-preserving highlighting technique. Result of static visualization (a) and the corresponding highlighting results by different selection methods: (b,c) legend selection, (d) brushing selection.

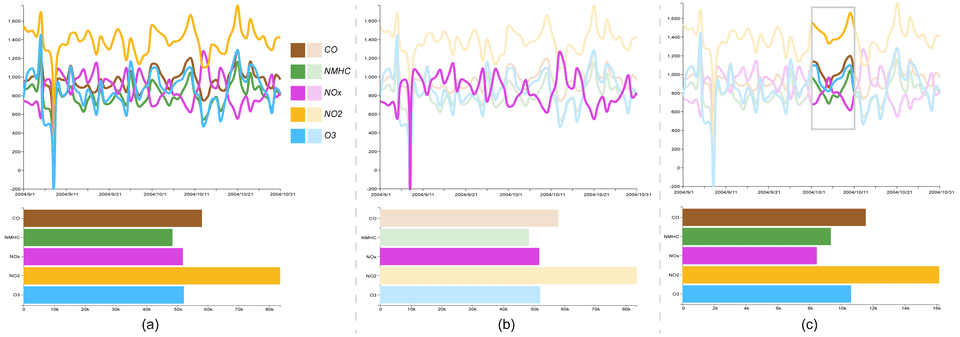
Figure 7: Visualizing an air quality dataset [5] using two linked views with our context-preserving highlighting technique. (a) (top) colorizing the line chart by using a salient color palette; (bottom) applying the salient palette to a bar chart; (b) (top) highlighting result by combining salient and faint color mapping schemes with legend selection; (bottom) corresponding bar chart; (c) (top) highlighting result for the brushing selection; (bottom) corresponding bar chart for the selected data. Our method produces a good highlighting effect while maintaining class discriminability during interactive exploration.
Acknowledgements
The authors like to thank the anonymous reviewers for their valuable input, this work was supported by the grants of the National Key Research & Development Plan of China (2019YFB1704201) and NSFC (62132017, 62141217), as well as by the Deutsche Forschungsgemeinschaft (DFG, German Research Foundation) under Germany’s Excellence Strategy - EXC 2117 - 422037984.