A Perception-Driven Approach to Supervised Dimensionality Reduction for Visualization
Yunhai Wang, Kang Feng, Xiaowei Chu, Jian Zhang, Chi-Wing Fu, Michael Sedlmair, Xiaohui Yu, Baoquan Chen.Abstract
Dimensionality reduction (DR) is a common strategy for visual analysis of labeled high-dimensional data. Low-dimensional representations of the data help, for instance, to explore the class separability and the spatial distribution of the data. Widely-used unsupervised DR methods like PCA do not aim to maximize the class separation, while supervised DR methods like LDA often assume certain spatial distributions and do not take perceptual capabilities of humans into account. These issues make them ineffective for complicated class structures. Towards filling this gap, we present a perception-driven linear dimensionality reduction approach that maximizes the perceived class separation in projections. Our approach builds on recent developments in perception-based separation measures that have achieved good results in imitating human perception. We extend these measures to be density-aware and incorporate them into a customized simulated annealing algorithm, which can rapidly generate a near optimal DR projection. We demonstrate the effectiveness of our approach by comparing it to state-of-the-art DR methods on 93 datasets, using both quantitative measure and human judgments. We also provide case studies with class-imbalanced and unlabeled data.
Results
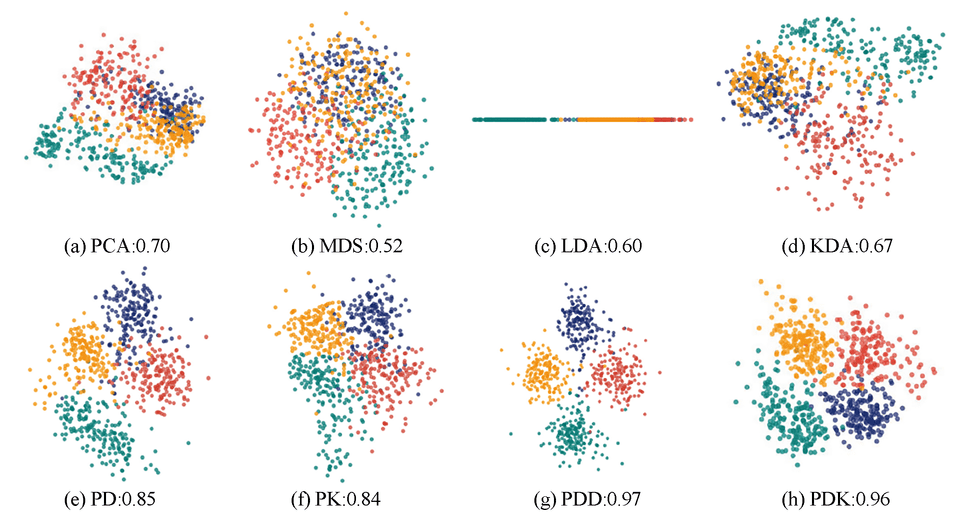
Figure 1: Comparing the performance of different DR methods (first row) and our proposed methods (second row) in visualizing a 64-dimensional dataset with four classes shown in different colors: (a) PCA; (b) MDS; (c) LDA; (d) KDA; (e) our perception-driven DR with DSC (PD); (f) ours with KNNG (PK); (g) ours with density-aware DSC (PDD); (h) ours with density-aware KNNG (PDK). We can see that the four classes are mostly mixed together in the visualizations produced from the existing methods (first row), though KDA can roughly separate the red and cyan classes. Our methods (second row) produce visualizations with clearer visual class separation, specifically for PDD and PDK, which use the new density-aware measures. The GONG scores (see the numbers above) quantitatively confirm this result. Note that (a) and (b) are unsupervised DR methods, while (c)-(h) are supervised, that is, taking class labels into account.
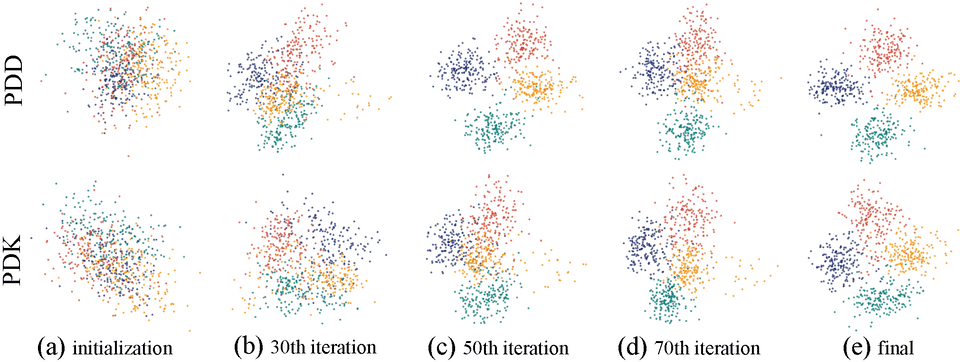
Figure 2: Illustration of convergence, where the top and bottom rows show the results of PDD and PDK, respectively. (a) results of the random initializations; (b) results after 30 iterations; (c) results after 50 iterations; (d) results after 70 iterations; and (e) final results.
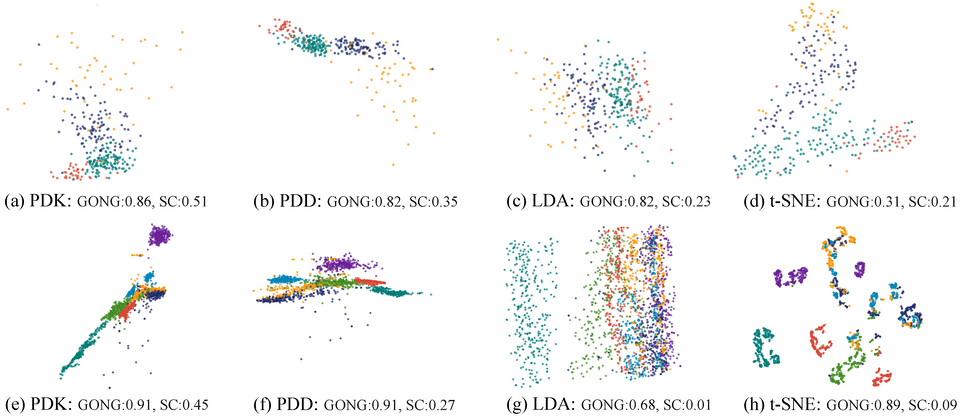
Figure 3: Comparing the class separation quality of PDK, PDD, LDA, and t-SNE (left to right) on FORESTTYPE dataset (top) and STATLOG (bottom) dataset, where the resultant GONG and SC scores for each data are shown next to each subfigure.
Acknowledgements
This work is supported by the grants of NSFC-Guangdong Joint Fund (U1501255), NSFC (61379091, 91630204), the National Key Research & Development Plan of China (2016YFB1001404), Shandong Provincial Natural Science Foundation (11150005201602) and the Fundamental Research Funds of Shandong University.


